Trace any path
through millions
of points.
Like UMAP, but neighbors are preserved exactly. TMAP builds a minimum spanning tree over your data - so you can compute shortest paths, measure tree distance, and extract sub-trees that scatter-plot embeddings can’t answer.
- Metric
- jaccard · euclidean · cosine · custom
- Data
- molecules · proteins · embeddings · images · text
- License
- MIT · open source
Four steps from vectors to a navigable map.
TMAP builds a minimum spanning tree over a nearest-neighbor graph, then lays that tree out in two dimensions. Unlike t-SNE or UMAP, neighbors are preserved exactly- because they’re connected by tree edges, there is no lossy projection from the high-dimensional space.
The graph is the source of truth; the layout is one way of looking at it. Change the random seed and you get a different drawing of the same tree.
The pipeline has four stages: approximate nearest neighbors (MinHash LSH for binary inputs, cosine or euclidean distance for continuous ones), a sparse kNN graph, Prim’s algorithm for the spanning tree, and a force-directed layout.
Each stage is parallelized and streams. On a single workstation the full pipeline runs to tens of millions of points- no GPU required. Larger jobs distribute trivially because the kNN step is embarrassingly parallel.
Because the result is an actual tree, you can compute exact shortest paths between any two points, measure tree distance, and extract sub-trees for analysis.
These are queries that scatter-plot embeddings can’t answer - and they’re what makes TMAP useful for SAR analysis, lineage tracing, and any task where the route between two points matters as much as the points themselves.
Not just a map - a workbench.
Build a TMAP, then explore it. These are three of the tools you get in the browser. For the full list, see the manual.
→ See all featuresFilter by any property, in real time.
Multi-column filter panels - numeric ranges, categoricals, computed expressions. The tree stays visible underneath so you can see how the subset relates to the rest.
Lasso a region, export to CSV.
Draw a free-form selection to pull out any subset of the map. Live summary statistics on the selection; one-click CSV export for downstream analysis in pandas or a notebook.
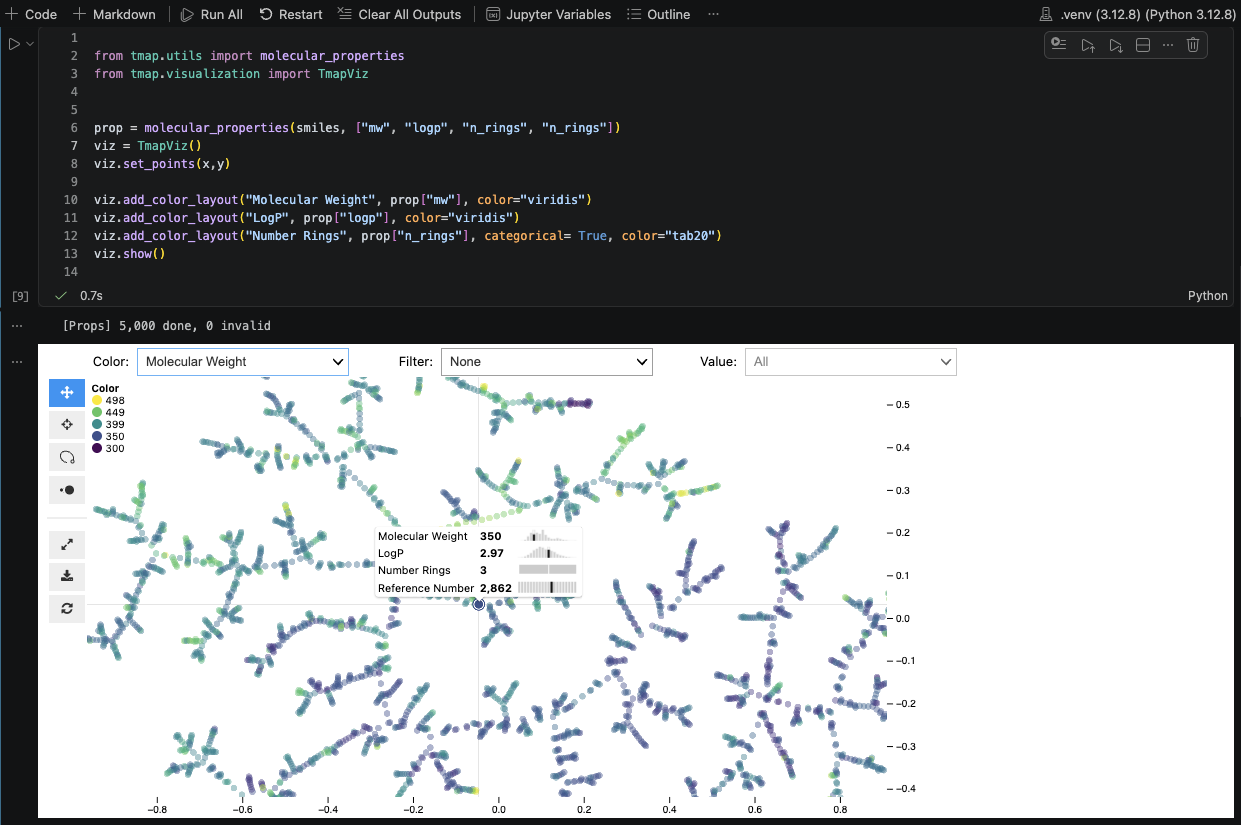
Three lines in a notebook.
Sklearn-style API: TMAP().fit(X) and you have a map. Call .show() for an interactive inline view via jupyter-scatter - no HTML export, no extra files.
One shape, any data.
TMAP 2.0 is a single sklearn-style class. fit, transform, add_points, save, load. Works on anything you can represent as a vector.
- Metric
- jaccard · euclidean · cosine · custom
- Data
- molecules · proteins · embeddings · images · text
- Install
- pip install tmap2
# Build a TMAP from anything - here, sentence embeddings
from tmap import TMAP
from sentence_transformers import SentenceTransformer

enc = SentenceTransformer("all-MiniLM-L6-v2")
X = enc.encode(documents)

model = TMAP(metric="cosine", seed=42).fit(X)
model.plot("docs.html", color=topic)In the wild.
Medicinal chemistry SAR exploration
TMAP over 2M internal compounds at a large pharma - used to identify scaffold hops between discovery programs and pull neighboring series for re-screening.
Protein fold clustering
Embedding of 50k AlphaFold predictions into a single tree to identify evolutionarily related folds outside the known SCOP classes.
Natural product diversity
COCONUT database visualization for scaffold diversity analysis in natural-product-inspired compound libraries.